

Utilizing Support and Resistance Levels
Part 4 of 4: Applying fibonacci levels to identify support and resistance.
By Toni Hansen
Over the last couple of months we have been looking at different types of support and resistance levels, starting with the core price support and resistance and then applying it to channels, followed by moving averages. In today's session I am going to show you another type of indicator support/resistance tool. I will be giving an overview on utilizing fibonacci retracement levels in your trading.The Fibonacci Series upon which these levels are based upon is a result of the work of an Italian mathematician named Leonardo Pisano, which went by the name "Fibonacci". In case this sounds a bit odd, it is merely a contraction for "Son of Bonacio", who was his father. He observed that in nature there are certain patterns that appear to crop up and introduced a series of numbers to identify these patterns. The sequence of the Fibonacci numbers is as follows:
0, 1, 1, 2, 3, 5, 8, 13, 21, 34, 55, 89, 144.... up to infinity.
Starting with zero and adding one begins the series. The calculation takes the sum of the two numbers and adds it to the second number in the addition. This is very exciting to you I am sure up to this point! :)
Where Fibonacci comes into play in the market, however, is that after the eighth sequence of calculations, there are constant relationships that can be derived from the series. For example, if you divide the former number by the latter, it yields .618.
34/55 = .618181 ~ .618
55/89 = .617977 ~ .618
89/144 = .618055 ~ .618
Dividing the latter number by the former number derives another relationship from the sequence. This relationship yields approximately 1.618.
55/34 = 1.617647 ~ 1.618
89/55 = 1.618181 ~ 1.618
144/89 = 1.617977 ~ 1.618
Traders use these ratios to make projects upon a stock or commodity's price moves. When I first began trading, a friend of mine introduced me to the fibonacci series. Coming from a background in archaeology, I was already aware of its application in other areas, so it intrigued me that it would also work in the market. I began to play around with Fib levels. I kept it very simple. The main Fib levels I use are listed on our charts page. They are 138.2%, 100%, 61.8%, 50%, 38.2%, 0%, and -38.2%. Two other numbers often used when applying Fibonacci numbers to chart analysis, 0.786 and 1.27, are the square roots of 0.618 and 1.618. I do not use these myself and never have, but you will likely see them referenced from time to time if you decide to go more in depth in studying Fib levels.
FIGURE 1 - Fibonacci Levels
http://www.tonihansen.com/classes/FibLevels.gif

I began as an equities trader, but I quickly discovered that while Fib levels will work in the equities market, the probability is even higher in the commodities market. I have no idea why this seems to be true, but for that reason, I tend to use them more when trading the EMinis than anything else.
Now, those of you that know me well know that I actually use very little for indicators anymore and often do not even show my moving averages, but this has more to do with being able to read the pace and use price support and resistance for identifying the turning points in the market and less to do with the validity of the indicators. I just like to keep things the least cluttered as possible. Both moving averages and Fibonacci levels, however, are very good visual tools to assist in identifying major support and resistance levels in the market.
As a bit of a quick review, remember that as with any support or resistance level, the faster the momentum or pace of a move into a fibonacci level, the more give it will have. We will see this a little later using an example from this morning of a support level I called in the room.
One of the things people tend to find daunting with fibonacci levels is exactly how to draw them. They get rather wrapped up in what trend move to use to apply the tool too. In all honesty, it doesn't really matter, as long as you deal with a complete trend move. What this means is that if you are looking at a downtrend, then once you no longer have lower lows and lower highs then you can use that trend move to apply the fibonacci levels to. Trend channels, as discussed several weeks ago, are also a helpful tool, since once a trend channel breaks, that means you can also use that trend move to apply fibs to.
Let us look at a couple of examples. Please refer to Figure 2.
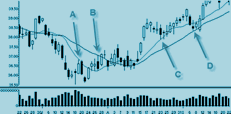
FIGURE 2 - ES Fibonacci Support/Resistance
http://www.tonihansen.com/classes/Fibonacci_1.gif

This is the trend move that we were following yesterday morning. It contained the typical three waves and was the breakdown move out of the prior day's congestion. Once the downtrend channel broke shortly after 11:00 am ET, then you can use your trend tool set to fibonacci and connect the highs of the downtrend move to the lows of the downtrend move. This projects each of the fibonacci levels from that point onward.
What I find intriguing about Fibonacci levels is that when I draw them on a major trend move, such as on a 15 minute time frame, if I leave them in place overnight, the will continue to hold in days to come, even as more trends are created on that same time frame. Obviously if you continue to do this without cleaning it up then your charts will become rather cluttered though!
FIGURE 3 - ES Fibonacci Support/Resistance
http://www.tonihansen.com/classes/Fibonacci_2.gif

The image in Figure 3 is the same one as in the previous chart, but it shows the projections of the fibs, along with the s/r levels identified. Notice that heading into noon the momentum was on the stronger side, so on the second wave of upside off the lows, after first stalling at the 38.2% retracement, the ES continued past the 50% level and into the 61.8% zone. When a continuation pattern is forming, it is rather common to see a security chop around between the 38.2% level and 61.8% level before breaking higher. You can use this to help project price targets on a breakout. When the prices are evenly displaced between those two levels, then the price projection on a breakout is also an equal move projection as per our discussion on pure price support and resistance levels from early last month.
FIGURE 4 - YM Fibonacci Support/Resistance
http://www.tonihansen.com/classes/Fibonacci_3.gif

Fibonacci levels are not limited to the retracements within a trend move. They can also project price targets and support and resistance levels and lay outside the scope of the trend move itself. For instance, if we look at the three wave trend lower into almost 12:30 on the 11th off the 11:30 ET highs, then we can connect the highs of that trend to the lows of that trend move on this smaller 2 minute time frame. It retraced back into the 61.8% level before continuing lower.
FIGURE 5 - YM Fibonacci Support/Resistance
http://www.tonihansen.com/classes/Fibonacci_4.gif

When it broke lower into 13:00 ET (as shown on Figure 5), you will see that it proceeded to the next Fibonacci level. In this case it was the -38.2% retracement. This helped predict a bounce off that price zone. The YM then fell into a range between the 0% and -38.2% retracement levels before triggering a third wave of selling into 15:15 pm ET.
FIGURE 6 - YM Fibonacci Support/Resistance
http://www.tonihansen.com/classes/Fibonacci_5.gif

By stepping back a time frame to the 5 minute charts, once can more easily discern this new trend. It had three strong waves of selling and then reversed into the close.
FIGURE 7 - YM Fibonacci Support/Resistance
http://www.tonihansen.com/classes/Fibonacci_6.gif

Following that reversal, the first resistance it ran into was a combination of not only the price congestion from mid-afternoon, but it hit the 38.2% fibonacci retracement level on the head. When dealing with congestion zones, it can be a little difficult knowing where in that zone the move will stall. By adding a fibonacci level, it can help narrow down the price a bit more accurately. The second resistance level after the lows was also a price resistance level at the prior highs. This was the 100% fib retracement. After prices reversed at that point, they fell into the 61.8% level and held almost perfectly once again. Again, however, also note the price support from the previous day. Whenever you have these combinations of support or resistance zones, those levels are going to have more strength to them. If you want confidence, this is one way to build it. If you cannot identify more than one reason for a support or resistance level to hold, the chances are less that it actually will, or that it will to any significant degree.
FIGURE 8 - ES Fibonacci Support/Resistance
http://www.tonihansen.com/classes/Fibonacci_7.gif

Fibonacci levels work for both intraday and all sessions time frames in the commodities market. The term "all sessions" refers to trades taking place outside the 9:30-16:00 ET time frame. I actually didn't get to sleep last night because I was trading the ES at that time. :)
After catching the 3:00 ET reversal, I wanted a way to project price levels for support as the morning progressed. Knowing I had this class today, I threw up the FIb levels for the ES based upon that morning rally which began at about 23:00 yesterday evening.
FIGURE 9 - ES Fibonacci Support/Resistance
http://www.tonihansen.com/classes/Fibonacci_8.gif

While not perfect, notice that each of the major stalling points on the 3 minute time frame fell at a Fibonacci price zone. When the market fell apart at 7:00 am ET it barely took a second to notice the 100% retracement level and dropped into the 138.2% instead. Since the momentum was so extreme, the exact prices surpassed the exact price of the fib level, but notice how it still congested at it. This shows that despite the slightly lower lows, it still reacted to that fib zone. The market then popped back into the 100% retracement level and continued later on into the 38.2%. Once again the was on stronger momentum. Heading into the open it fell back into the 100% and price support. This is at #5.
FIGURE 10 - ES Fibonacci Support/Resistance
http://www.tonihansen.com/classes/Fibonacci_9.gif

As trading continued past the open, these fib levels from the wee hours of the morning continued to hold. The resistance level I gave early in the day at 9:53 was based upon the 50% retracement, which combined with earlier price congestion. The support I then posted at 10:04 was a reflection of the 138.2% retracement, as well as prior lows (#1).
FIGURE 11 - ES Fibonacci Support/Resistance
http://www.tonihansen.com/classes/Fibonacci_10.gif

Since that move from around 3 am to 7:30 am broke higher just prior to the open, another set of fib lines could be drawn, or adjusted, to fit the new trend. This trend off the lows was choppier and only broke around 10:00 when it failed a new high, making it a two-wave correction move instead of three-wave uptrend. You could use that move, however, to then project lows at the 138.2% retracement. Some may have used the 8:30 am low to the 9:00 ET high and just watched that more concise move. The zone of the 138.2% on that would have been about the same. You would have had to have considered the fact that the momentum was very sharp into the low, hence adding a bit more give to it. The Fib levels drawn early in the day, however, continued throughout the session.
FIGURE 12 - ES Fibonacci Support/Resistance
http://www.tonihansen.com/classes/Fibonacci_10a.gif

Hopefully, for those of you looking to add a bit more assistance in identifying s/r levels, you will find these fibonacci levels to be extremely helpful. There are other applications of fibonacci in the marketplace as well. Some use them for time extensions to help identify how much longer it will be until another reversal. For this they will use a trend move, calculate the time of that trend move and project the fib levels out in terms of time. Lucas numbers or levels are another application of similar principles of fibonacci that many traders use. So, if inclined to follow this line of study, these are two additional areas you may wish to explore.
I will now open the room up for questions...
jball: good stuff
Toni: ty jerry
trauma: thanks Toni
billgi: very helpful
crack32: what fibonacci retracement do u need to buy minolo's on sale?
Toni: lol
six_: can Fibo levels be used to trade stocks intraday
Toni: 12 yes
six_: thanks, Toni
Helena1045: What fib level did we achieve today? :)
Toni: just a sec... i will show you :) We are at the -38.2% on the daily off that last trend move on the ES btw
FIGURE 13 - ES Fibonacci Support/Resistance
http://www.tonihansen.com/classes/Fibonacci_11.gif

crack32: toni u ever get urself second guessing which trend ie- larger trend vs using a fib on a phoenix type of setup on faster time frame?
Toni: Not really... If I am daytrading I tend to want to see the trend on a 15 min chart, but may draw the fibs on a smaller time frame.
crack32: ok so 15 is what u use it on mostly?
Toni: Yes, but in terms of seeing the trend.
crack32: ok
Toni: If it's choppy on that time frame I go higher. But, then when I actually draw the Fibs, I will take the 15 min highs and lows and use them on say a 5 minute chart. This way I can see them as prices develop on that smaller time frame. Does that make sense?
cszanto: sure
crack32: yeah ok.
cszanto: thx
Helena1045: Yes, does.
cszanto: How do you use the FIBO levels if the market is choppy? Do you use the shadow or the body of the candel?
Toni: Always use the shadows.
tanker: thx toni--are you manually calculating your fib values?
Toni: No, I have a tool in my charting platform that projects them. With the time extensions some charting platforms have those as well. You will have to check though, since it is not as popular.
cszanto: have you ever used the time extension?
tanker: yes --tradesation has a stretchable grid that I use on evry chart
Toni: No, I don't, but I have friends that swear by them.
cszanto: no suprise
opw3: thanks for the class Toni
Toni: yw oscar
Helena1045: That was a wonderful class. Thank you!
billgi: another nice class !..ty toni
Toni: you are welcome :)
jball: thx Toni
unocapricorn: when looking for higher highs and lows, do you include the shadows?
Toni: yes
tanker: yes thank-you :)
unocapricorn: thanks
cszanto: c u next time, thanks for the good class!
redtrade: I don't get your daily email anymore. Do I sign up again?
Toni: Please go to tonihansen.com and enter your address it is a double opt-in system now so it will send you an invitation and you will need to confirm your subscription. It is still free of course i will post the links to the different lists:
http://www.tonihansen.com/
Main page is the market action letter,
http://www.tonihansen.com/longterm-trading.html
bottom of this page is the position trader,
http://www.tonihansen.com/trading-lessons.html
and top of this is the educational one.
redtrade: You are apart from most rooms/traders, they don't want to reveal what they are actually doing
Toni: lol yeah... I know, my bf tells me that all the time. haha.. He thinks I'm crazy.
redtrade: Got burned by a couple of them in 2000-2002
redtrade: Well, it is a way to give back after one becomes successful
Toni: I enjoy it so that helps... Playing school was a favorite pasttime as a child.. Maybe that is it. lol
redtrade: It is a terrible journey without mentoring from the right person.
Toni: yeah.. i never had a mentor and never read trading books which i still get harrassed about because many never believe that
cszanto: but y are a mentor :)
Toni: I picked up a lot from friends over the years, but not realy much within my first 5 years of trading... never really had much of a clue what others were doing until I was already successful. Now I know what to avoid and am more open to hearing what others have to say, although I admit that when they start talking about complex indicators and systems I tend to tune out... In all honesty it was because it was simply so overwhelming. Brandon gave me books to read, but when math is not your strong suit trying to make sense out of a lot of what people were doing was rather daunting. So I just went with the fact that I was trained as an artist and just picked out the patterns myself. :)
redtrade: maybe next month I can contact you and share what I am doing, what I developed for day/micro trading stocks
cszanto: got a question, how long did it take to meka profitable or succesfull?
Toni: well after about 6 months i was breakeven but to really gain consistency it took over 2 years
redtrade: you did better than I. Ruined an account
Toni: When I started managing money it was a step back.. Was almost like starting over because of the emotional aspects coming into play again. People run into the same thing when they borrow money, so I really discourage that.
redtrade: ditto. The mind becomes an enemy sometimes.
Toni: Well.. Ii lost about 20% at the lowest point. That was a shared account with Brandon so we lost 20%.
ShootingStarr54: do you get all hung up on the major indexes spx etc confirming what your stock
Toni: Not really shooting star. I like it if they do, but if dealing with news and momentum stocks then it is not as important.
ShootingStarr54: thanks
ShootingStarr54: do you ever trade a one candle pullback if it is a very big candle
Toni: I will drop down to a smaller time frame and use the move within the candle.
ShootingStarr54: so If i was using a daily candle then used the move of the smaller time frame do I then have to trade the smaller time frame or could I go back to the daily?
Toni: You can go back to the daily use the smaller for timing larger for targets.
ShootingStarr54: nite & thank you very much
Follow us on:


Testimonials for Toni Hansen
"Dear Toni, I want to thank you for sharing the knowledge and insights you have gained over the years as a professional trader. I would recommend your CD and mentoring to anyone serious about consistently making money in the market, regardless of market conditions. As an experienced investor who has watched you firsthand, it is clear that you are a world class trader. Thanks for helping me become a better trader." - Guy Allen, Florida
“I owe you so much when it comes to my development as a trader. You have been a guiding light... I will always look back on you as a key element in that success. Thank you so very much...” - Greg
“Anyone who is trading needs your guidance for the education of trading. Your education of trading aspects is the GREATEST thing I have ever used. I learned more in two weeks from you, than from any books I read. THANKS AGAIN!” - Clarence E. Austin
“I'm done for the day and am very pleased...I have taken all your calls and follow them to the T...the NQ ones that is (trade QQQQ) and I play the gaps in the morning also (I'll take the 71% chance anytime)...I have turned myself around...First time in months...Thank-you! ”- Richard Widen
“I hope that everyone truly understands just how fundamentally sound and accurate your market trading strategies and concepts are. I have been trading for quite some time, and I just want you to know that I have been so very impressed with your substance based upon sound trading fundamentals and not "fluff" THANK YOU...” - Randall Morrow