TRADING LESSONS
So You Want to Become a Trader?
Knowledge is power. This is as true in trading as any other area of life. Those who don’t know will eventually give their money to those who do know. In this industry we have 90% of the money going to 10% of the players. Do you want to be part of that 10%? Below is the knowledge that can assure you success as a trader.
All my best,

Toni Hansen
Start here, select a Lesson:
|
When a novice trader first enters the marketplace, s/he is bombarded with decisions regarding where to begin and what approach to take when it comes to trading and/or investing. There are as many styles of successful trading as there are traders, and which direction a trader takes is a very personal decision. There are four major factors one must consider in making this decision:
How a trader answers each of these questions will depend upon many factors, including, but not limited to, overall market expertise and knowledge, patience, emotional reactions to price movement, and the amount of time they can devote to the markets. Let’s look at each of these in a bit more detail. Which type of market analysis will I employ? This question has two possibilities: fundamental analysis and technical analysis. Fundamental analysis is based upon the belief that markets “misprice” a security in the short term, but that the “correct” price will eventually be obtained. This type of analysis is most commonly employed by long-term traders and investors using company data such as earnings and growth to provide a directional bias for a security’s upcoming price movement. Technical analysis, on the other hand, is rooted in the premise that the price of a security already reflects all relevant factors such as earnings and cash flow. While many fundamental analysts use technical analysis to a certain extent, a pure technical analyst does not care at all about the fundamentals of a security. Instead, they look at price action within the security to guide them in predicting the security’s next move. Personally, I am a pure technical analyst. Even though I know many fundamentalists who do quite well from an investment perspective, all of my own investment decisions are rooted in the analysis of the security’s price activity. Which markets or security should I focus on? In this day and age, the current market which is all the rage is the foreign exchange market (most commonly known as the Forex or FX market). This is the largest and most liquid market in the world and the where currencies are traded. An inherent danger involved in Forex trading is the amount of leverage many traders use. This means that they are often taking positions much larger than the cash value of their account. The risk of loss is thus greatly increased as well. The FX market is a 24-hour market, however, and is thus very popular since it can be traded by those who already have a full-time job outside the market. Another popular market is the options market. An option is a rather versatile security which can be used in a number of ways, such as speculating or hedging risk against an asset. For most traders, this is the most difficult type of security to learn to trade successfully and tends to have a longer learning curve than when compared with the others. A fourth popular market is the commodities market. This is also known as the futures market. The most popular futures are the E-Mini index futures. These include, but are not limited to, the mini-sized Dow Jones Industrial Average (the YM), the E-Mini S&P 500 (the ES), the E-Mini Nasdaq 100 (the NQ), and the E-Mini Russell 2000 (the ER). This market is popular for many of the same reasons as the Forex market. It is also nearly a 24-hour market and offers large leverage without the requirement of a large cash account. Then there is the straight stock market. This market involves the purchase of the absolute shares in a company. In order to open and close numerous positions within one trading day in the stock market, you must maintain an account of at least $25,000. Which strategies should I employ for trading? This question deals with style and the tools a trader uses when analyzing a potential trade. Many traders will use indicators such as moving averages, Fibonacci levels, stochastics, etc. to help provide them with a directional bias in terms of a security’s price. The rule of thumb that I recommend is to not stray too far from the mainstream and not to become too overloaded with numerous indicators. Many indicators, such as moving averages, have a bit of self-fulfillment to them and can be quite useful to a novice. Traders expect the moving averages levels have an impact on prices and hence make trading decisions based upon them. Of course, this is only part of the picture, but still food for thought. The main problem with indicators is that many traders will ignore underlying price activity and when the indicators are giving contradictory signals it creates confusion. Many indicators will also tend to lag price movement and hence by the time a trader initiates a position based upon an indicator, they have already sacrificed a large portion of a security’s price movement and potential gain. In addition to indicators, a trader’s strategy will also involve decisions such as which charting methodology to use. The most popular are line charts, bar charts, point and figure chart, and candlestick charts. Next, a trader must decide which signals to use on the charts themselves in addition to any indicators. A popular strategy is to trade breakouts from a trading range. Another is to focus on trend-following methods such as buying pullbacks in a security which is moving higher. Most trading systems and strategies are not this simple, however, and must involve entry and stop techniques, as well as profit-taking techniques. It often takes a great deal of trial and error for a trader to begin to recognize which set of market conditions give them the most accurate readings and hence the best positions. Nearly all the time I spend with my mentoring clients is devoted to developing their own systems of trading which focus on honing in on their own personality traits and expertise as applied to the market. The decisions involved in this part of the process are often the most difficult and I would highly recommend keeping a detailed trading journal. Just don’t forget to include charts! Which time frame should be my primary focus? It is here that a trader is pressed with the question of just what to call themselves, but it is one that is more a matter of pure semantics and has less to do with their success or failure than the other decisions thus far. The question is merely rooted in which time frame the trader wishes to focus upon. A trader that looks to get into and out of a move intraday just based upon an initial movement in terms of momentum is called a scalper. They may only hold things for several minutes at a time. A trader who is in an out of most of their positions within a single day is labeled a daytrader. A trader who holds a position for several days on average is called a swingtrader. A trader who holds for several weeks to several months is often referred to as a core trader or a position trader. A trader who looks to hold a position for several years is often not called a trader at all, but is instead termed an investor. Each time frame can involve a somewhat different mentality in that the emotional and risk aspects of trading on the different time frames tend to affect people differently. Some people have a difficult time holding positions overnight and loose sleep worrying about what could happen. These traders are best cut out for intraday trading. Others find that when they trade positions intraday they take their gains and losses too quickly and don’t let the positions play out. They may be better off backing off to a larger time frame and checking on open positions much less actively. Most strategies and pattern-based setups, however, will work on any time frame, no matter which a trader wishes to focus upon, and I trade my same system on all of the above time frames, but will employ some strategies more often on position trades in stocks than on daytrades in the E-Minis simply because of opportunity and timing factors. A word of advice: Do not get too obsessed when you first begin trading to make sure you fit perfectly into one category or another. I began my career purely as a swingtrader, looking only at daily charts of stocks, but now I not only swingtrade, but hold longer term, scalp intraday, and daytrade. I also trade more markets than simply stocks these days as well, most notably the E-Mini futures. I found that while I certainly have a core style and system in place, I apply it to many markets and time frames and have a rather extensive arsenal to allow me to adapt to changing market conditions flawlessly. Just realize that no one begins medical school to become a neurologist by only taking the classes that specialize in that field. Not only does that specialty alone involve knowledge of other aspects of medicine than just the brain, but the student might find out rather quickly that they simply are not cut out for it and end up in a completely different area of expertise! Feel free trying out a number of different strategies and markets to begin with. Just be responsible about it and keep risk to a bare minimum until you find the best fit!
Toni Hansen, To learn more about Toni’s trading style and the strategies she utilizes to consistently pull profits from the markets, check out her detailed CD course: "5 Technical Signals You Should NOT Trade Without" at http://www.swingtrader.net.
8 Traits of a Successful Trader The market is an ever-changing entity, each day presenting us with different and unique scenarios with no two days every the same. Nevertheless, the market is more or less a reflection of people's ideas and attitudes and while it is also true that no two people are alike, each and every one of us has something in common with someone else, whether it’s the way we get out of bed in the morning or the foods we prefer to eat. Additionally, we tend to repeat actions, such as preferring to brush our teeth at a certain time of day or making sure we try to catch the Thursday night prime time television shows. No matter which angle you look at it from, humans are creatures of habit and this tendency gets reflected in a security’s price movement. It's what makes technical analysis a reliable and profitable method for analyzing the market. Unfortunately, technical analysis is not always cut and dry. The same core pattern does not work the same way in every market environment. For instance, one of the setups I often look for on a daily chart is a 3-5 day pullback in an uptrending stock for buying opportunities. Where newer traders tend to get in trouble, however, is taking such a setup to mean that every time an uptrending stock pulls back 3-5 days and then breaks the previous day's highs that it means they should buy it. In reality, there are always exceptions and its learning what these are that can be the dividing line between those traders who are successful and those who fail. In this example, how a security pulls back in a primary uptrend, as well as overall market conditions, will greatly influence whether taking such a pullback as a long is really worth the risk to reward. In some cases it is not. The ability to adjust to changing market circumstances is just one of the traits of a successful trader. In truth though, there are quite a few. Over the years I’ve mentored quite a few traders. Many succeeded, but many of the traders I have spoken with over the years have failed. I have observed a number of traits which are present in those who succeed. Some of the top traits of successful traders are as follows: 1. They stay neutral; 1. Staying Neutral You're probably wondering away just what do I mean by “staying neutral.” When you are chatting with your trading buddies online or reading a message board and all you hear are how the market maker or specialist is out to get them, or how one minute they are a market god and the next they have what is certifiably the worst luck in the entire world, then you are dealing with a trader that is NOT staying neutral! They are letting each trade or each trading day rule their emotions and this pressure builds upon itself, making it very difficult to succeed. The professionals don't let the day to day oscillations in their accounts faze them. The results of one day of trading, or even a few weeks or a month are not as important to them as the average over time. Among most of the professional traders I know, you cannot tell by their mere appearance whether or not they had a great day in the market or if they lost. Sure, they may tell you one way or the other. We are not robots devoid of all emotion after all, but when we leave the market for the day after a difficult session, we are able to disassociate it from the rest of the world and don’t spend the rest of the day complaining or moping around the house thinking that entire world must be out to get us. Similarly, on a great day, we do not call up every person we can think of and tell them how we rule the market universe. Extreme emotional responses either way will often lead to greater difficulty in the market since emotions take over from reason and can often override it, making it difficult to remain objective. 2. Have business Plan Most successful traders also have a business plan. As in any other profession, it’s important to know what it entails in order to succeed. As in any business, this consists of a set of rules or guidelines to help keep the trader on track and from making decisions purely on a whim. Would you open a restaurant with out a plan? No, or at least I really hope that you wouldn’t! A new restaurant owner must take into account the type of cuisine they wish to serve, the décor of the restaurant, the hours of operation, to whom they are catering as clientele, etc. As in the restaurant business, traders must also have a business plan. A partial list of the questions you should be asking yourself and including in your trading plan are as follows: How must time will you spend study and trading? The more comprehensive your plan is, the better. You can always go back and change it, modifying it to suit your development as a trader. I find that it is very helpful, for instance, to go back and read over my techniques and goals whenever I am in a slump and my progress has stalled. It helps me maintain the right frame of mind so that I can push forward. 3. Keep a Journal One of the first questions I ask any of my new clients is whether or not they have a trading journal, and if you, what does it consist of. Most traders don’t even have a journal. Those that do have one typically keep it in a spreadsheet format. This offers very few insights into a trader’s personal style and strengths and weaknesses. Some things to consider when developing a trading journal are: What techniques were used in locating the position? It is also important to print out a chart of your trade. Mark both the entry and exit on the chart. If necessary, print it out on several time frames to show the details of the position. 4. Focus on Several Techniques that Work Well Let’s take a minute to look at a typical college student. What kind of person majors in general studies? Unless they go on to focus on a specific occupation in graduate school or law school, etc., well-paying jobs will be hard to find for most of these students upon graduation. Instead, for those who focus their studies in one field, and more specially, one subdivision of that field, demand for their skills will be much higher. If you focus on just a few techniques, it allows you to really become an expert on the technique you are using. Great traders have several strategies that are their bread and butter plays and they will focus on them for as long as the market conditions favor them. Remember: The jack of all trades and master of none is usually a low-paid, unskilled worker. 5. Being a Great Money Manager Great traders are also great risk managers. They respect the risks they are taking and on each trade they risk a small amount of capital. Usually this is 1/4% to 1% per position (and no more than 2%). The idea is that you can't trade tomorrow if you blow out today and if you can't trade you won't be a great trader, now will you? Great traders protect their accounts. It's their baby. Each position is so small they don't really care what happens with it. It's just a nick... win, lose, or draw. So, if they have a 200K account and are risking 1/4% on each trade, if they take a stop they are out $500. That's a very small amount of money compared to the account. They can take a couple of hits and still be in the game. 6. Being Comfortable with Risk and Uncertainty The sixth trait of great traders is that they are comfortable with risk. Let's face it, trading is certainly risky and if you are afraid of the risk you won't last. If you are afraid you will lose money, then I can say with near-certainty that you will. Great traders are comfortable trading a pattern that is not a 100% sure-thing, because there simply is no such thing. Many new traders have a terrible time with this: the uncertainty of a trade, but you must over come it. It is very easy to allow yourself to become frozen with fear over the risks and uncertainties of trading. Great traders get beyond it. 7. Accepting Personal Responsibility Great traders accept personal responsibility for everything they do, even to an extreme. If I loan you $100 and you never pay me back, then yes, perhaps you are not a very honorable person, but I also made a poor choice to lend you the money in the first place. I made that choice, however, and I must accept personal responsibility for that action. The same concept applies to trading. Many traders, lacking the expertise and confidence to make all their own decisions to begin with, will rely upon others for advice. The input may come from CNBC or it may come from a newsletter service or trading chatroom or message board. It doesn’t matter where you get the original idea from, it is still up to you to implement it or not and you have the due diligence to stand behind your decisions and make them your own, whether they succeed or fail. 8. Using Risk Capital to Trade Finally, great traders use risk capital. This should be obvious. They trade with money they can afford to lose. It is very difficult to trade well if you are worrying about paying your mortgage or putting food on the table. I’ve also seen a number of traders over the years take out equity loans to open a trading account. You are supposed to be limiting your risk and outside stressors, not adding to them if you wish to succeed. If you think you can be one of the exceptions, then you should really think again! Trading with risk capital frees up your mind. It lets you trade and not worry about every little stop you have. You can just focus on trading correctly instead of trying to force yourself to meet certain financial needs. They say scared money never wins. Well, I have yet to see a person who has no other source of income or savings make a living off their $5,000 trading account. Many of these traits may take a bit of time to acquire. Overcoming the fear of loss, for instance, haunts many, but by focusing upon these traits and characteristics, my hope is that you may model your own frame of mind to those who have come before you and have made the leap to a successful and long-lasting career in the markets. It is said that the majority of successful people in the world became such by following in the footsteps of others, their mentors. Even if you do not have one specific person in mind, familiarizing oneself with the traits of those whom have succeeded before you is a great place to begin!
Toni Hansen, To learn more about Toni’s trading style and the strategies she utilizes to consistently pull profits from the markets, check out her detailed CD course: 5 Technical Signals You Should NOT Trade Without at http://www.swingtrader.net.
My style of trading is based upon technical analysis. This means that I look for patterns in price movement to give me a directional bias for a security or the overall market itself. In this segment I will share with you a couple of the technical tools which I use to assist me with locating the highest probability positions each and every trading day. Candlestick Charting There are a number of styles of charting which can be used by a trader to view price activity in a security. The most common ones are line charts, bar charts, point and figure charts, and candlestick charts. My preferred charting style is candlestick charting. I find that this gives me the most visual representation of price action and most of us do very well with visual stimuli. Candlestick charting was first developed in Japan approximately 4 centuries ago. The fact that it is still in use today is testimony to its perpetual nature. The first step to understanding candlestick charting is to understand how to read a candlestick. In the common Western-style bar chart a vertical line represents the highs and lows during a span of time, while a small horizontal line on the left represents the price trading at the beginning of that segment of time and a small right horizontal line represents the last price traded during that span of time. The charts below show a typical Western bar chart on the left with its candlestick equivalent on the right. As you can see, it is much easier to see the buying versus the selling in the candlestick chart at a glance than in the bar chart. The middle of the rectangular or square area is called the “body” of the candlestick, while the lines above and/or below the body of the candlestick are called “shadows” or “tails.” The Japanese consider the body to represent the essential price movement with the shadows/tails being mere price fluctuations. This does not mean, however, that the tails are not important. As you will learn, the entire price range of a candlestick is important in determining the direction the stock will most likely move, but the body of the candlestick is a pivotal determining factor.
The following images display typical candlestick pattern formations and how to read them. In the cases where the opening price is lower than the closing price, the candlestick bar is called an “up” or “open” candlestick. They are considered to be bullish. I use white to represent open candlesticks, but green is another popular color.
When the open of a candlestick bar is higher than the closing price, then the candlestick is considered bearish and is called a “down” or “closed” candlestick. I use black to represent this type of candlestick, although red is also frequently used.
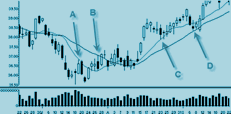
An Introduction to Trends One of the first things an aspiring trader needs to learn is what a trend is and how you go about identifying a trend. A trend is the primary direction of price movement in a given time period. A stock may have a number of different trends going at the same time so it is important to determine the time period you want to focus on. The trend we use most often in swing trading is the daily trend but you should also be able to identify the weekly and intraday trends as well. Simply put an uptrend is a series of higher highs and higher lows while a downtrend is a series of lower highs and lower lows. The third type of trend is a sideways trend. This occurs when prices move up and down within an established range. The following image is designed to give you a basic idea of what the three types of trends look like.
In an uptrend note how each new high is higher than the previous one while each successive low is also higher. Often the high of the last "swing" in the trend will serve as support for the next low. These areas are circled. In a downtrend note how each low is lower than the previous one while each successive high is also lower. Often the low of the last "swing" in the stock's trend will serve as resistance for the next high. These are also circled. Trading with Indicators I am not a huge fan of using indicators in my trading. Indicators are visual tools which traders and investors add to their charts in order to emphasize certain attributes of a price or volume move. Many traders swear by them, but I tend to hold the point of view that too many indicators will draw attention away from the underlying price activity and lead to false readings of price development. The general rule of thumb which I would use when considering the use of a particular indicator is that the more mainstream and popular it is, the more it will often tend to work, although I’m sure some may indeed disagree with me! Nevertheless, if possible, keep the number of indicators you use to a minimum. One of the most popular indicators used by traders today is the moving average. A moving average is used to show the average value of a price data over a period of time. A simple moving average (sma) gives equal weight to each time period of data, whereas another popular moving average known as the exponential moving averages (ema) gives more weight to the most recent data. While both simple and exponential moving averages work quite well, when I use them, I use simple moving averages whose prices are based upon the closing price of each bar used in the calculation. For instance, if I am looking at the 20 day simple moving average, then I am looking at the average closing price on the day over the past 20 days of trading. Moving averages are a form of support or resistance. Support and resistance levels are zones in which a price move is likely to stall or reverse. Moving averages are typically sloping in a trend move. In an uptrend, a moving average such as the 20 period simple moving average would be a bullish support level and when a security pulls back into that support level it is likely to bounce off it and continue higher. The more extended the uptrend, however, the less likely it becomes that the security will move quickly off the support. The following chart of Dryships Inc. (DRYS) shows two typical reactions to a moving average support level. The first example is in July when DRYS pulls back very sharply into the 20 period simple moving average. In this instance the moving average stalls the descent and pushes DRYS into a longer trading range on the daily time frame. In September the moving average hits again. This time the pullback into the support is more gradual and on lighter overall volume during the correction off highs. This time the support level holds securely and the stock begins to once again advance quickly to new highs. Notice, however, that in each instance, the moving average does not halt the pullback exactly. Support levels should not be thought of in terms of an absolute price, but rather a price zone. The same is true with all indicators.
Toni Hansen, |


To learn more about the specific details of Toni’s methods for analyzing and trading the markets and obtain a strong grasp on the concepts touched upon in this introduction to technical analysis, check out her Video course: 5 Technical Signals You Should NOT Trade Without. This course takes traders well past the core concepts laid out here and leads traders to a better understanding of their advanced applications and uses in trade strategy development.

Follow us on:


Testimonials for Toni Hansen
"Dear Toni, I want to thank you for sharing the knowledge and insights you have gained over the years as a professional trader. I would recommend your CD and mentoring to anyone serious about consistently making money in the market, regardless of market conditions. As an experienced investor who has watched you firsthand, it is clear that you are a world class trader. Thanks for helping me become a better trader." - Guy Allen, Florida
“I owe you so much when it comes to my development as a trader. You have been a guiding light... I will always look back on you as a key element in that success. Thank you so very much...” - Greg
“Anyone who is trading needs your guidance for the education of trading. Your education of trading aspects is the GREATEST thing I have ever used. I learned more in two weeks from you, than from any books I read. THANKS AGAIN!” - Clarence E. Austin
“I'm done for the day and am very pleased...I have taken all your calls and follow them to the T...the NQ ones that is (trade QQQQ) and I play the gaps in the morning also (I'll take the 71% chance anytime)...I have turned myself around...First time in months...Thank-you! ”- Richard Widen
“I hope that everyone truly understands just how fundamentally sound and accurate your market trading strategies and concepts are. I have been trading for quite some time, and I just want you to know that I have been so very impressed with your substance based upon sound trading fundamentals and not "fluff" THANK YOU...” - Randall Morrow